Definition and use of ‘Detrended Price Oscillator (DPO)
The Detrended Price Oscillator (DPO) tries to determine the price cycles of a given asset, identifying peaks and troughs out of the price chart and using this information to indicate entry and exit points.
Unlike other oscillators, such as the Stochastic or MACD, DPO is not a momentum indicator.
The calculation is quite simple: Price (X/2 + 1) periods ago minus X-period simple moving average, where X is the number of periods, 20 or 30 being the standard settings.
You can easily add this indicator to the chart in basically all charting software available in the market.
The historical peaks and troughs shown by the DPO provide timeframes for qualified entry and exit levels.
Combining the indications given by the DPO with other indicators like moving averages or MACD could generate really interesting strategies for stock and stock options trading.
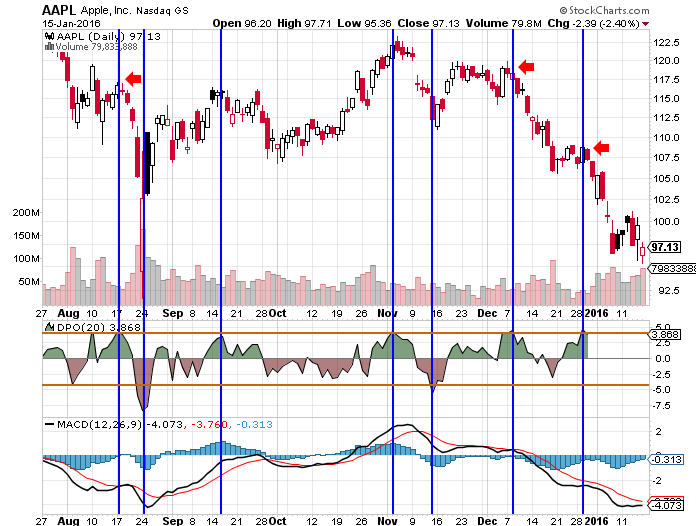
In the example below, we show a Apple chart with vertical lines in connection to what are supposed to be peaks and troughs according to the DPO.
There are two ways of using the DPO:
- one by identifying the average time lag between peaks and troughs,
- another by indentifying first the usual levels on the DPO chart where the indicator reverts to the other direction and then finding the peaks and troughs at these levels, like in the chart below.
The detrended price oscillator removes momentum from the picture and represents a simple and easy way of estimating the length of price cycles from peak to peak and from trough to trough.
The indicator seeks to reduce the impact of long-term trends in defining cycle length, focusing instead on short-term price swings.
As already indicated, the detrended price oscillator is an excellent market timing tool, which works even better if used in conjunction with other indicators.
Since the DPO is neutral with regard to price momentum, a good combination is DPO and MACD.
An Example of DPO with Moving Average Convergence and Divergence
As you can see in the chart above, matching the MACD entry signals with the peaks and troughs indications given by the Detrended Price Oscillator, only three are the entry signals, highlighted by the red arrows in the picture.
For a thourough description of how to use the MACD you can read the MACD article.
Conclusions
The detrended price oscillator represents a simple way of identifying prices cycles, removing momentum and long-term trends from the price pattern and focusing on short-term cycle length.
Used in combination with momentum indicators the DPO could return reliable entry and exit points that the trader can use in stock and stock options trading.


