Download the Indicator
Relative Strength Indicator is leading indicator for a trend change and usually it anticipates a change in the trend.
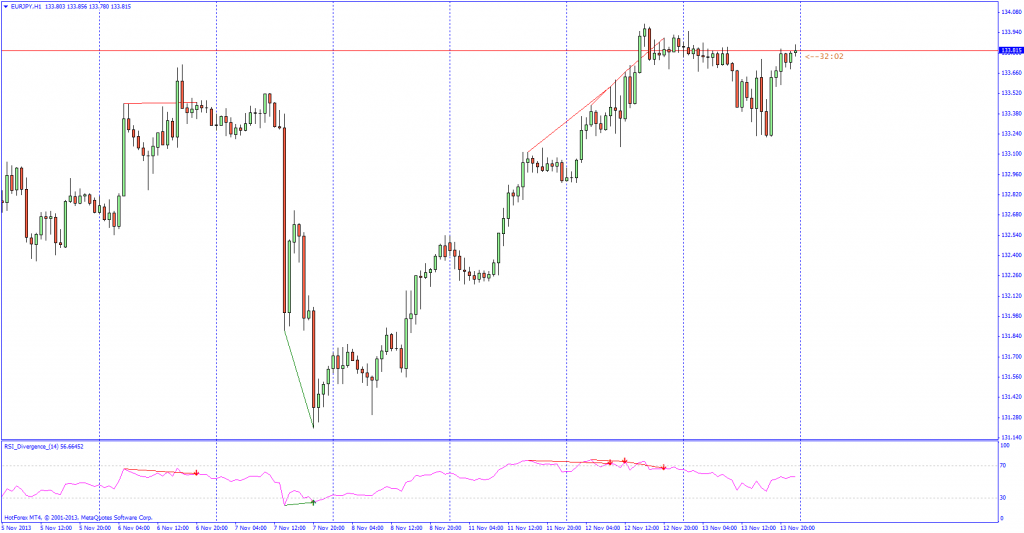
When divergence arises between RSI indicator and the price it means that trend is close to a reversal.
Even if the RSI divergence Indicator is a good alert for a change in the price direction, nevertheless the divergence is not so good in indicating the precise timing of this reversal.
For this reason, technical traders usually use the RSI Divergence Indicator as an preliminary warning system to enable them to get ready and prepare for a forthcoming trend change.
When the RSI Divergence Indicator and chart price line moves in the same direction we have a confirmation that the existing price trend is unlikely to change. On the contrary, when the RSI line slopes differently from the price chart line, a divergence happens.
If the RSI Divergence takes place below the 30% area or forms a peak above the 70% level, the signal for a change in the trend is then accomplished.
Divergence signal does not occur each and every time when a trend changes, but when it does, it will deliver a strong confirmation that a trend change is coming.
Divergence signals give an advantage to the trader by confirming an entry in the bullish or bearish trend; if the tarder is already in the market, the RSI divergence can be used to get out of a position as the trend loses power.
These are the settings for RSI Divergence Indicator:
period: select the number of periods on which the RSI is calculated;
drawIndicatorTrendLines: if set to “true” it will draw trendlines on the RSI Divergence Indicator
drawPriceTrendLines: if set to “true” it will draw trendlines on the MT4 Chart
displayAlert: if set to “true” it will show alert when RSI Divergence has formed
DisplayClassicalDivergences: if set to “true” it will show Classical Divergences
DisplayHiddenDivergences: if set to “true” it will show Hidden Divergences

