Download Keltner Indicator for Metatrader 4
The “Keltner Channel Strategy” is a relatively easy strategy, suitable for both beginners and advanced traders.
Keltner Channels Indicator consists of volatility envelopes, and for this it is similar to Bollinger Bands in that they both use standard deviation to calculate the bands.
Keltner Channels Indicator uses Average True Range (ATR) to set the bands.
Keltner Channels Indicator is a trend following indicator, and it is used to identify reversals and breakouts out of the channel.
It is also used to identify overbought and oversold levels when the market moves sideways.
Keltner Channels Indicator is a good tool for beginner traders, by identifying and visualizing the swings and the channel that Forex prices design.
These are the standard settings for Keltner Channels Indicator:
TimeFrame: 5 min
Symbol: any major currency preferred EUR/USD, GBP/USD, ect
Risk: MAX 2% of account equity per order
Indicators:
Keltner Channels Indicator set to 40 Periods
Exponential Moving Average set to 8 periods
Keltner Channel Strategy Overview
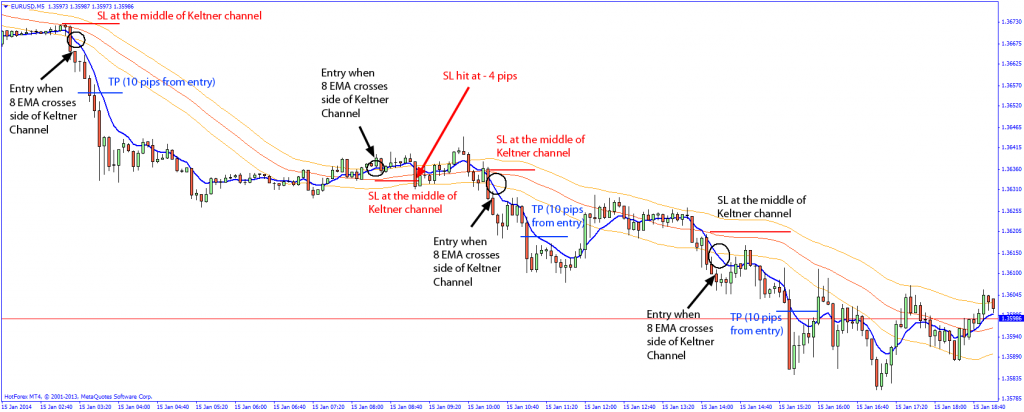
When you have the chart setup with Keltner Channel Indicator and Exponential Moving Average you are all set to go.
You should use this strategy only on 5 min timeframe.
Wait for the EMA to be inside the Keltner Channel; when the price moves outside the Channel and the EMA breaks out of the Keltner Channel (which should happen right after the price breakout, then:
SELL if channel is broken downward
BUY if channel is broken upward

